Welcome to DU! The truly grassroots left-of-center political community where regular people, not algorithms, drive the discussions and set the standards. Join the community: Create a free account Support DU (and get rid of ads!): Become a Star Member Latest Breaking News Editorials & Other Articles General Discussion The DU Lounge All Forums Issue Forums Culture Forums Alliance Forums Region Forums Support Forums Help & Search

Bernardo de La Paz

(60,320 posts)
8. Nasdaq
Mon Nov 3, 2025, 02:40 PM
Nov 3

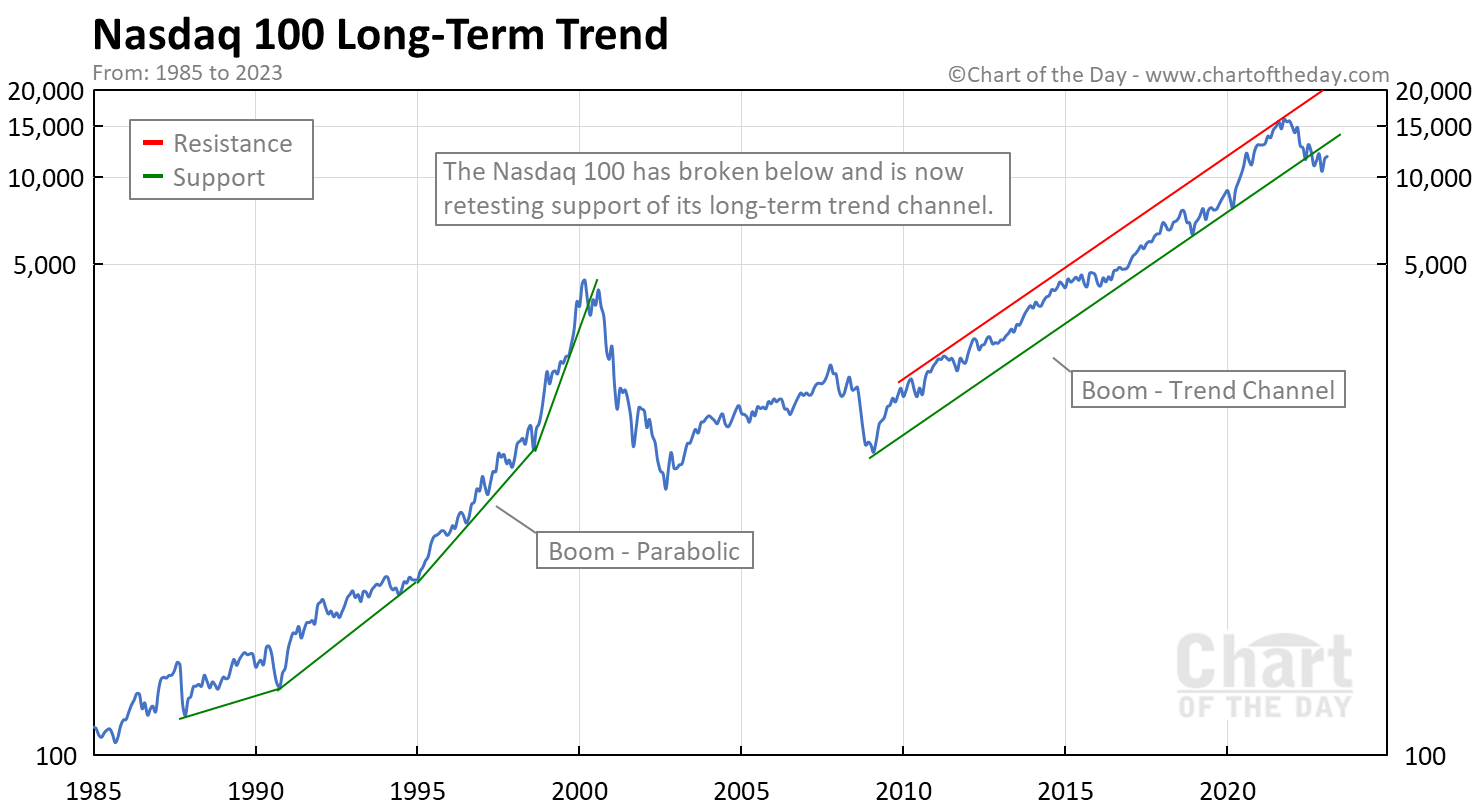
Here is a great chart, but it doesn't display properly on my browser. I have to right-click it and choose Open in New Tab.

It shows the NASDAQ in logarithmic (log) volume (the only realistic way to look at stocks and indices). You can see the parabolic rise up to 2000, which is one difference between this bubble and the dot-com bubble, and a reason why I think this bubble is less severe than that one. You can also see the 15 or 16 years it took to get back the value. The trend channel it illustrates is very interesting.

Nasdaq has since recovered and reached new highs. One could probably draw a new trend channel, a bit shallower.

I found the site: https://www.chartoftheday.com/nasdaq-100-long-term-trend


Recommendations

0 members have recommended this reply (displayed in chronological order):

Latest Discussions»Culture Forums»Personal Finance and Investing»No, AI is Not A Bubble»Reply #8