Last edited Fri May 23, 2025, 01:43 AM - Edit history (2)
 Edited
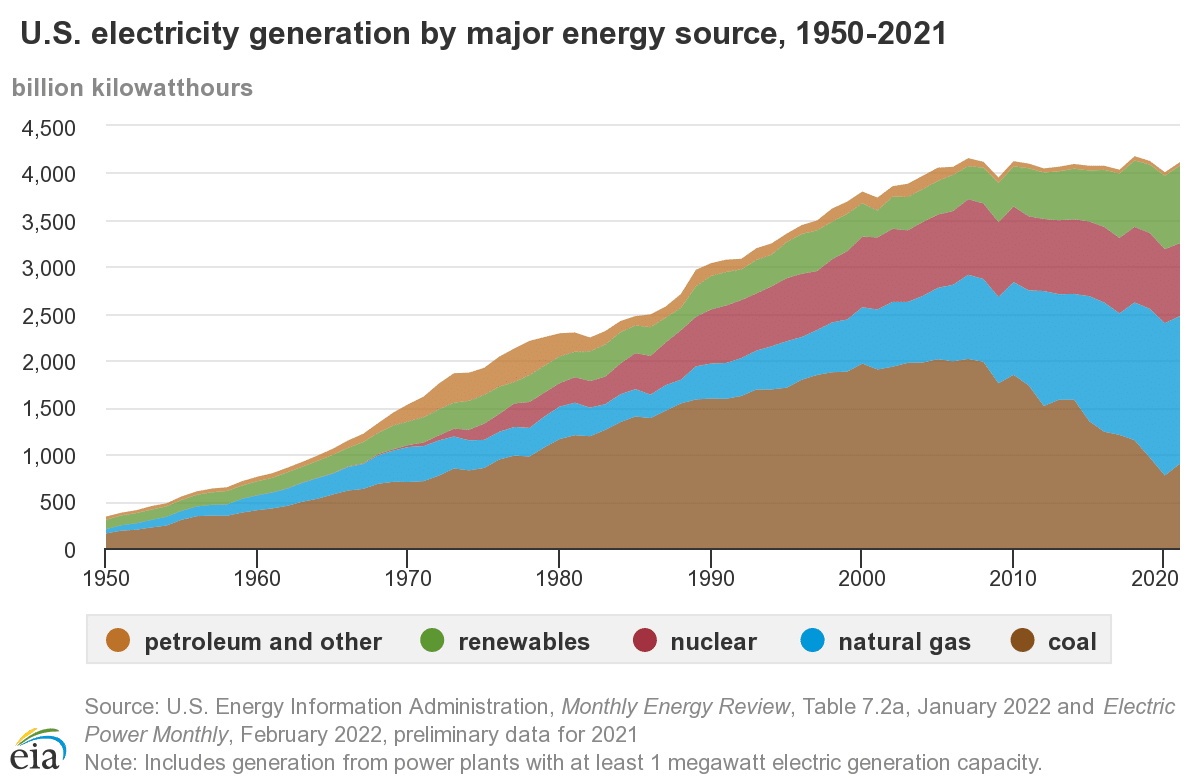
: looking for something later, I found statista in archive.org but the latest figures are just through 2023:
2005: 4,055, 2010: 4,125, 2011:4,100, 2015: 4,078, 2016: 4,077, 2017: 4,034, 2018: 4,178, 2019:4,128, 2020: 4,007, 2021: 4,116, 2022: 4,243, 2023: 4,178 -- so note that 2023 is the same as 2018, so we're essentially talking about a flat spot from 2007 thru 2023 (16 years) /EDIT
It was during those flat years where the carbon emissions from electricity generation went down in the U.S., thanks mostly to natural gas replacing a lot of coal (natural gas is filthy, but only half as filthy as coal as far as greenhouse gas emissions per KWH). And thanks to solar and wind. And finally, that electricity generation and consumption was essentially flat was helpful.
Well, now electricity growth is expected to skyrocket as multiple sources say, it will be next to impossible to keep greenhouse gas emissions from growing at least for the next few years if 25% growth in electricity in just 5 years were to occur.
As for air conditioning load, that is expected to skyrocket too. A small rise in average temperature results in an exponential increase in very hot days:

The graph illustrates that a small shift to the right in the average shifts the whole bell curve to the right, and, in this illustration makes hot weather (orange) much more common and extreme hot weather (red) from almost zero probability to considerable probability
Much more at link:
https://www.democraticunderground.com/10143266574#post1
======================================================
Why your air conditioning bill is about to soar - the energy required rises with the SQUARE of the temperature difference
https://www.democraticunderground.com/1127174891
 = new reply since forum marked as read