Welcome to DU! The truly grassroots left-of-center political community where regular people, not algorithms, drive the discussions and set the standards. Join the community: Create a free account Support DU (and get rid of ads!): Become a Star Member Latest Breaking News Editorials & Other Articles General Discussion The DU Lounge All Forums Issue Forums Culture Forums Alliance Forums Region Forums Support Forums Help & Search

OKIsItJustMe

(21,583 posts)
16. OK, here's a table for you
Wed Nov 20, 2024, 12:56 PM
Nov 2024

No soothsaying allowed. We especially don’t want stated policies. We know those are simply political, and are certainly not a trustworthy indication of the future.


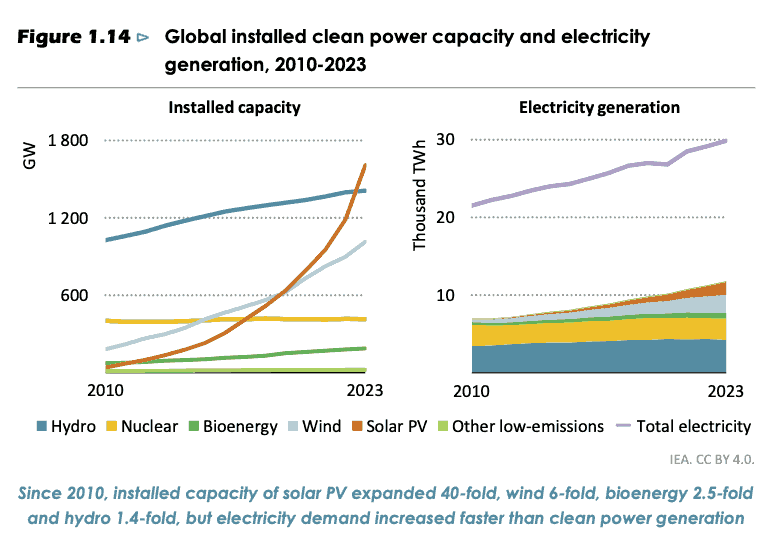
Now, this figure (for example) includes no soothsaying. It only includes data from 2010 through 2023, but, since it does so visually, it is easy to pick out trends over time.


A keen eye may be able to differentiate between a growth curve and a straight line.

Recommendations

0 members have recommended this reply (displayed in chronological order):

It's not like we've run out of ecosystems to fuck up for reactionary fantasies, have we? There are still more... NNadir Nov 2024 #1
This message was self-deleted by its author jfz9580m Nov 2024 #2
Figure 1.14 Global installed clean power capacity and electricity generation, 2010-2023 OKIsItJustMe Nov 2024 #3
Figure 2.1 - Global total energy supply, 2010-2023 OKIsItJustMe Nov 2024 #4
Figure 2.15 IEA indices for clean energy and upstream oil and gas, and global average price of selected clean energy... OKIsItJustMe Nov 2024 #5
Figure 3.1 - Global total energy supply by source and fossil fuel share by scenario, 2000-2050 OKIsItJustMe Nov 2024 #6
Figure 3.3 - Global installed capacity of renewables, 2010-2030, and emissions reductions by scenario, 2023-2030 OKIsItJustMe Nov 2024 #7
How pretty! Replete with soothsaying! None of it... NNadir Nov 2024 #11
Do you trust the report or not? OKIsItJustMe Nov 2024 #13
I trust the DATA in the report, not the soothsaying. An educated person, as opposed to a credulous rube... NNadir Nov 2024 #15
OK, here's a table for you OKIsItJustMe Nov 2024 #16
Um, it is apparently a waste of time to do what should be... NNadir Nov 2024 #17
Table B.4a Technology costs in selected regions in the Stated Policies Scenario OKIsItJustMe Nov 2024 #18
Table B.4a (Edited) OKIsItJustMe Nov 2024 #19
Figure 3.21 - Global electricity generation by source and scenario, 1990-2050 OKIsItJustMe Nov 2024 #8
Figure 3.24 - Share of renewables in electricity generation by country/region and scenario, 2015-2035 OKIsItJustMe Nov 2024 #9
Figure 3.27 - Power sector investment by technology and scenario, and share in emerging market and developing economies, OKIsItJustMe Nov 2024 #10
Figure 3.42 - Clean energy technology contribution to energy combustion CO2 emissions reduction in the APS, 2023-2050 OKIsItJustMe Nov 2024 #12
Table A.1a - In Context OKIsItJustMe Nov 2024 #14
Latest Discussions»Issue Forums»Environment & Energy»PR: Eco Wave Power Receiv...»Reply #16