Environment & Energy
In reply to the discussion: PR: Eco Wave Power Receives Final Permit from U.S. Army Corps of Engineers for First Onshore Wave Energy Project at ... [View all]
NNadir
(36,183 posts)...more shorelines to lace with plastic floats and wiring, so let's get to it.
Of course, LA harbor, if one has been there, is already an industrial park, so it's not quite as bad as say, tearing the shit out of thousands of square miles of once pristine desert in California for wind turbines that can't produce as much electricity as the Diablo Canyon Nuclear Plant can produce on a 12 acre footprint.
Diablo Canyon Nuclear Plant Output 2023 (12 acre footprint): 17,714 GWh.
All the fucking wind turbines in California 2023 spread over untold square miles of ruined landscapes: 13,920 GWh.
California Energy Commission (accessed 11/19/2024).
Personally, I've been hearing about wave power for my whole adult life, and I'm certainly not a young man.
All that bullshit, promoted on websites powered by electricity overwhelmingly generated by gas and coal hasn't done a damned thing to change this outcome:
Week beginning on November 10, 2024: 423.60 ppm
Weekly value from 1 year ago: 421.00 ppm
Weekly value from 10 years ago: 397.33 ppm
Last updated: November 18, 2024
Weekly average CO2 at Mauna Loa
But of course, we shouldn't give a flying fuck about numbers, should we? It's FIRST!! On Shore Wave Power, FIRST!! Hydrogen This! FIRST!! Hydrogen That! FIRST!! Solar! FIRST!! Wind, year after year, decade after decade, no matter how many fossil fuels are burned, no matter how much wilderness burns from extreme global heating.
The chants have lost all meaning, long after the reactionary fantasy lost all sense of rationality. The reactionary "renewables will save us" rhetoric has played out, in flames.
It's certainly not the FIRST!! time we've heard carrying on about wave power, which doesn't, after decades of hearing about it, doesn't even show up in the WEO data below as measurable.
It's 2024. It is still true that 8 + 8 EJ (solar and wind) is not greater than 30 (nuclear) EJ, nor is it an appreciable fraction of 676, in percent talk, certainly not one that matters a little over 2%, this after trillions squandered on solar and wind, this on a planet where over 1.5 billion people still do not have basic sanitation services, such as private toilets or latrines.
Happy talk! Of course, I'm less than happy that there are people who believe that 8 + 8 is greater than 30, and who lack the intellectual depth to stop crowing about as much. Floating crap in Los Angeles Harbor is not going to a damned thing to slow the vast ongoing tragedy.
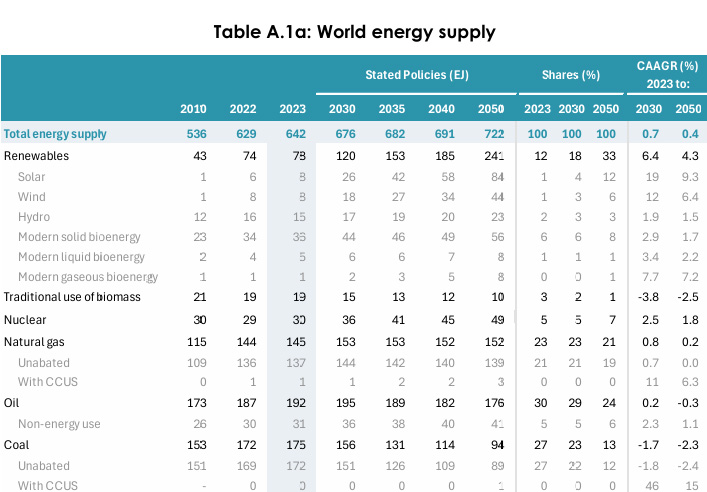
IEA World Energy Outlook 2024
Table A.1a: World energy supply Page 296.
Edit history
Recommendations
0 members have recommended this reply (displayed in chronological order): = new reply since forum marked as read
Highlight:
NoneDon't highlight anything
5 newestHighlight 5 most recent replies
RecommendedHighlight replies with 5 or more recommendations
= new reply since forum marked as read
Highlight:
NoneDon't highlight anything
5 newestHighlight 5 most recent replies
RecommendedHighlight replies with 5 or more recommendations