Private payroll losses accelerated in the past four weeks, ADP reports
Source: CNBC
Published Tue, Nov 25 20258:15 AM EST
The U.S. labor market is showing further signs of weakening as the pace of layoffs has picked up over the past four weeks, payrolls processing firm ADP reported Tuesday. Private companies lost an average of 13,500 jobs a week over the past four weeks, ADP said as part of a running update it has been providing. That’s an acceleration from the 2,500 jobs a week lost in the last update a week ago.
With the government shutdown still impacting data releases, alternative data like ADP’s has been filling in the blanks on the economic picture. Government agencies such as the Bureaus of Labor Statistics and Economic Analysis have released revised schedules, but critical reports such as the monthly nonfarm payrolls count won’t come out until December.
Policymakers at the Federal Reserve won’t have much of the usual data they use to make forecasts when they meet again Dec. 9-10. However, in recent days, several officials have advocated for additional interest rate cuts, causing the market to recalibrate expectations to now expecting a reduction at next month’s meeting.
“With the next jobs report now scheduled for December 16 and CPI for December 18, there is little on the calendar to derail a cut on December 10,” Goldman Sachs chief economist Jan Hatzius said in a client note Sunday.
Read more: https://www.cnbc.com/2025/11/25/private-payroll-losses-accelerated-in-the-past-four-weeks-adp-reports-.html
 = new reply since forum marked as read
Highlight:
NoneDon't highlight anything
5 newestHighlight 5 most recent replies
= new reply since forum marked as read
Highlight:
NoneDon't highlight anything
5 newestHighlight 5 most recent replies

marble falls
(69,627 posts)
NoMoreRepugs
(11,738 posts)
groundloop
(13,489 posts)
BumRushDaShow
(163,814 posts)and is pretty much an extrapolation of surveys done of their own customers who use ADP to do their payroll processing (which is quite a lot).
They usually come out with their numbers just ahead of the government numbers, the latter that includes pretty much "all" (at least "non-farm" ) employment stats (private and government workforces).

Javaman
(64,961 posts)To be updated and revised downward
progree
(12,588 posts)the ADP National Employment Report and ADP Small Business Report are derived from ADP payroll data representing 460,000 U.S. clients and nearly 26 million workers
https://finance.yahoo.com/news/september-2021-adp-national-employment-121500533.html
the above link is no longer good, but archive.org has it:
https://web.archive.org/web/20211207005815/https://finance.yahoo.com/news/september-2021-adp-national-employment-121500533.html
How they extrapolate from 20% to the remaining 80%, I have no idea.
====================================
There aren't any BLS jobs report numbers coming out until December 16 -- nearly a week after the Fed's December 10 rate-setting meeting. So ADP is all we're getting for awhile.
====================================
Something I wrote in August and haven't updated.
ADP numbers normally vary a great deal from the BLS numbers
for example private payrolls from ADP vs. BLS
The first column is the BLS private payrolls number month-over-month increases https://data.bls.gov/timeseries/CES0500000001?output_view=net_1mth
The second column is the ADP private payrolls month-over-month increases https://fred.stlouisfed.org/data/ADPMNUSNERSA (I had to do spreadsheet work to come up with the month to month differences)
The 3rd column is the difference between the BLS and ADP numbers
The first 2 columns are month-over-month increases beginning with February 2023. In thousands.
Positive ones in the 3rd column mean that the BLS number was higher than the ADP number.
BLS ADP DIFF
250 157 93
48 -53 101
167 132 35
166 52 114
170 146 24
110 138 -28
108 119 -11
89 95 -6
117 130 -13
97 100 -3
213 95 118
73 129 -56
151 91 60
169 82 87
129 113 16
160 164 -4
66 136 -70
40 42 -2
33 180 -147
208 194 14
-1 221 -222
244 204 40
287 176 111
79 186 -107
107 84 23
114 147 -33
133 60 73
137 29 108
74 -23 97 - ADP revised from -33 to -23
83 104 -21 - The latest, for July, reported 7/30 by ADP and 8/1 by BLS
===============================================================
I'm also reminded of the wild difference between two BLS employment measures:
https://www.democraticunderground.com/10143505265#post17
The headline payroll job numbers (+73,000 in July) come from the Establishment Survey
https://data.bls.gov/timeseries/CES0000000001
Monthly changes (in thousands): https://data.bls.gov/timeseries/CES0000000001?output_view=net_1mth
YEAR: JAN FEB MAR etc.
2022: 225 869 471 305 241 461 696 237 227 400 297 126
2023: 444 306 85 216 227 257 148 157 158 186 141 269
2024: 119 222 246 118 193 87 88 71 240 44 261 323
2025: 111 102 120 158 19 14 73
The last 2 months (June and July) are preliminary, subject to revisions
Last 12 months: 128k/month average
# Employed in thousands (down 260,000 in July) come from the separate Household Survey, http://data.bls.gov/timeseries/LNS12000000
Monthly changes (in thousands): http://data.bls.gov/timeseries/LNS12000000?output_view=net_1mth
If one adjusts the date range from 2021 to 2025, the graph is much more meaningful because it leaves out the huge swings of 2020 that greatly enlarges the Y axis and makes what follows look like tiny almost undiscernible squiggles around the zero axis
YEAR: JAN FEB MAR etc.
2022 1016 483 608 --315 487 --284 164 477 75 --126 --177 752
2023 958 178 417 162 --178 183 204 292 --33 --231 675 --762
2024 66 --177 412 70 --331 --9 64 206 377 --346 --273 478
2025 2234 --588 201 461 --696 93 --260
Last 12 months: 157k/month average
January and February of each year are affected by changes in population controls.
A very volatile data series from month to month. I used a double minus to make the negative ones stand out a little better
This Household Survey also produces the unemployment rate and labor force participation rate among many other stats
It shows how different surveys get different results.
For the KK! Brigade (Krasnov Krasnov! Brigade) - just look at the Biden-era numbers

Wiz Imp
(8,331 posts)between the Payroll survey and the Household survey. They are NOT measuring the same thing.
https://www.bls.gov/web/empsit/ces_cps_trends.htm
Comparison:
Employment concept
-Household Survey (CPS)-Estimate of employed people (multiple jobholders are counted only once). Includes people on unpaid leave from their jobs.
-Payroll Survey (CES)-Estimate of jobs (multiple jobholders are counted for each nonfarm payroll job). Includes only people who received pay for the reference pay period.
Employment inclusions and exclusions
-Household Survey (CPS)-Includes the unincorporated self-employed, unpaid family workers in family businesses, agriculture and related workers, workers in private households, and workers on unpaid leave. Excludes workers on furlough for the entire reference week, even if they receive pay for the furlough period (they are considered unemployed, on temporary layoff).
-Payroll Survey (CES)-Excludes all of the groups listed at left, except for the logging component of agriculture and related industries. Includes furloughed workers if they receive pay for any portion of the pay period that includes the furlough.
progree
(12,588 posts)ETA - and the Employed total count (https://data.bls.gov/timeseries/LNS12000000)
is larger than the non-farm payroll total count (https://data.bls.gov/timeseries/CES0000000001)
161.661 million vs. 158.942 million in December 2024 (1.7% larger)
(I chose end of 2024 so as not to run afoul of the KK! Brigade).

IronLionZion
(50,446 posts)Wiz Imp
(8,331 posts)This is something new called NER Pulse, a 4-week tracker released weekly which they began on October 28.
https://www.adpresearch.com/meeting-the-moment-adps-new-weekly-labor-market-pulse/
Like the debut of the NER, the launch of NER pulse is meeting a critical moment in the economy, which is being transformed by AI, demographic change, and short-term business cycle fluctuations. The NER pulse of private-sector hiring will provide a dynamic and granular view of job creation and loss at an unprecedented weekly frequency.
Three times a month, Main Street Macro will release preliminary estimates of the week-over-week change in employment based on a four-week moving average. These releases will have a two-week time lag to allow for more complete and accurate estimates of real-time employment trends.
We will continue to publish the final National Employment Report each month. This monthly report is built on a reference week that includes the 12th day of the month and typically publishes on the first Wednesday of the month. It provides breakdowns by industry, geography, and employer size, both seasonally and non-seasonally adjusted. We won’t publish the NER pulse during NER release weeks.
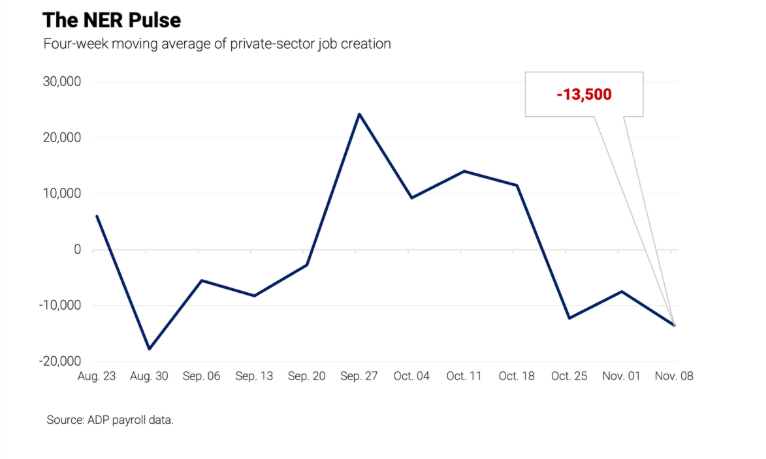
The release today is for the 4 weeks ending November 8. Extrapolating data from the previous report, it implies job losses for the week ending November 8 were likely significantly more than the 4-week average of -13,500..
progree
(12,588 posts)US retail sales rose less than forecast in September as key data returns after shutdown delays, Yahoo Finance, 11/25/25
https://finance.yahoo.com/news/us-retail-sales-rose-less-than-forecast-in-september-as-key-data-returns-after-shutdown-delays-133631795.html
=========================
US consumer confidence tanks in November as Americans see more financial pain ahead, Yahoo Finance, 11/25/25 https://finance.yahoo.com/news/us-consumer-confidence-tanks-in-november-as-americans-see-more-financial-pain-ahead-152417642.html
AP: https://finance.yahoo.com/news/consumer-confidence-slides-americans-grow-152413483.html
=========================
[PPI] Rising energy costs lift US producer prices in September, Reuters, 11/25/25
https://finance.yahoo.com/news/rising-energy-costs-lift-us-134917042.html
+0.3% in September after an unrevised 0.1% DROP in August. For the 12 months: +2.7%
(I didn't read the rest)
BumRushDaShow
(163,814 posts)progree
(12,588 posts)Shellback Squid
(9,804 posts)off from their jobs but not having much luck finding work, thank god I retired last year
twodogsbarking
(16,944 posts)Except for covid year and Trump, who fucked up covid. Imo